Data Production by Daniel Chae.
Introduction
With our historic political divide, growing economic issues, unrelenting pressure to produce on the job, rampant lack of sleep, and no escape from devices that constantly update and trigger us, Americans live in extremely stressful times. We pride ourselves on keeping our cool under pressure, lionizing unflappable icons like Captain Richard Phillips, who was taken hostage by Somali pirates hijacking his ship, to Captain Chesley “Sully” Sullenberger landing his damaged airliner on the Hudson. Not only are these modern heroes both calm, cool, and collected Captains, but the pair also share the high honor of being portrayed cinematically by Tom Hanks.
Your ability to keep a stiff upper lip may one day help save your life, too, if faced with an itchy-fingered mugger, but it could also help you get through everyday situations like interacting with the spouse or boss, dealing with a pushy salesman, driving in dangerous conditions, or trying to communicate with your Beats-wearing teen. Moreover, doctors agree that reacting to stress in unhealthy ways can increase your risk of high blood pressure, heart attacks, and strokes.1 When life throws you a curveball, do you curse or adjust your swing and hit it back up the box?
IMA Research wanted to explore America’s ability to stay calm in commercial situations and determine whether unflappability followed geographic and income patterns. In other words, when you walk into a car dealership, try to renegotiate your cable bill or shop for new auto insurance, how likely is it that your blood pressure rises, and you become agitated?
To answer this question, we mined data from callers purchasing TV and internet service in Los Angeles, New York, Chicago, and hundreds of other cities across the US.
Highlights
When we analyzed agitation levels in 1 million commercial phone calls from all 50 states and the District of Columbia, we discovered:
- Nearly nine percent of the conversations had callers losing their cool, or more than 1-in-12;
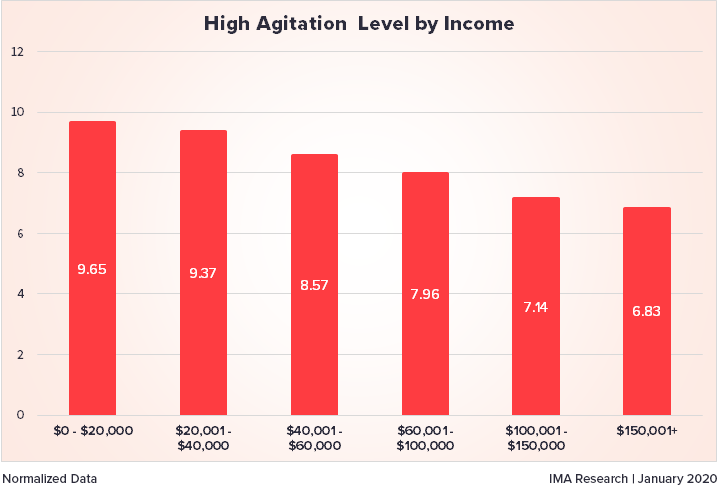
- The lower the caller’s income, the greater their propensity to rage;
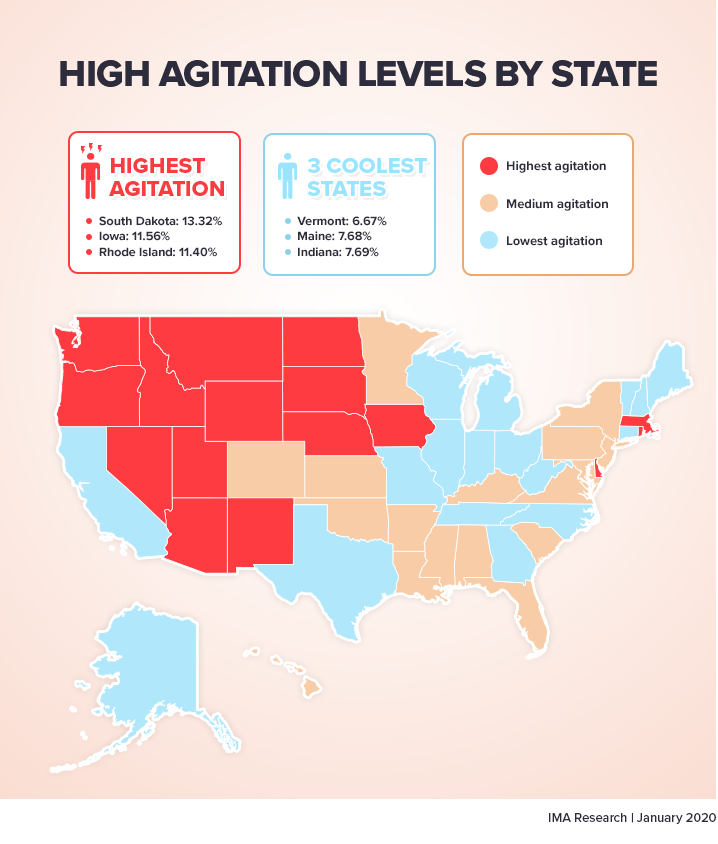
- People from South Dakota were most likely to lose their cool, with more than 13 percent of their calls registering high agitation;
- Vermont is the coolest state, with less than seven percent of their calls at a high agitation level, about half the rate of South Dakota;
- Among the top 10 most-populated states, New York was the most agitated (more than nine percent), while Illinois was the least (nearly eight percent);
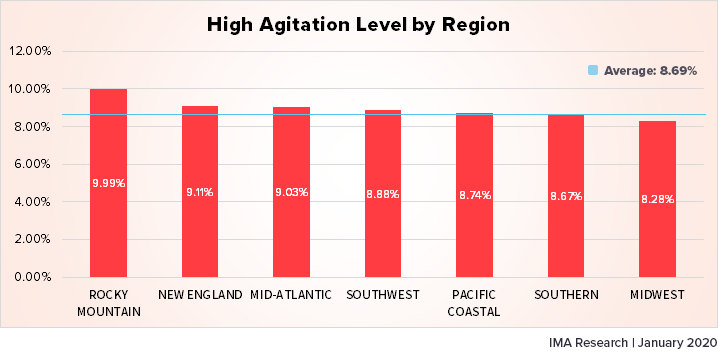
- With nearly 10 percent of their calls registering high agitation, the Rocky Mountain states, including Colorado, Idaho, Montana, Nevada, Utah and Wyoming, are the Continental U.S.’s “Ragin’ Region.”
Data Overview
IMA Research used sophisticated speech analytic tools to measure acoustic signals of emotion in 1 million calls made to sales centers over late 2019 and early 2020. Agitation was quantified by measuring levels and changes in speaker stress (volume) and tempo in more than 667,000 calls. Each of these calls, which lasted from 11 seconds to more than four hours, was judged to be of low, normal, or high agitation. Overall, more than 1-in-12 calls registered high agitation. The complete breakdown:
- High Agitation: 8.69%
- Normal Agitation: 51.03%
- Low Agitation: 40.27%
Income Influences Irritability
For nearly a quarter-million of the conversations, the caller revealed their income, which proved to be a good predictor of unflappability. The lower the income, the greater the tendency to get agitated, which aligned with our expectations.

High agitation occurred with 41 percent more frequency among lowest-income earners compared to the highest-income earners. With fewer resources at their disposal, those with lower incomes may naturally feel more stress in monetary situations. Moreover, losing their cool could cause them to lose their shirt, as agitation could lead them to make bad purchasing/credit decisions, which could worsen their already distressed economic standing. Developing stress-coping mechanisms could help them make better choices that ultimately could increase their income and break this cycle. As American philosopher and psychologist William James put it, “The greatest weapon against stress is our ability to choose one thought over another.”
State States State of Mind
Just as where you live can determine your approach to life and your speech patterns, geography can also affect your ability to keep cool. We were surprised when we examined the 660,000+ calls that could be broken down by state of origin and agitation levels, as what we assumed were laid-back states turned out to be anything but. Does your state keep its cool or lose its cool?

South Dakota had the greatest rate of high-agitation calls at 13.32 percent, much higher than second-place Iowa’s 11.56 percent and about twice as high as the coolest state, Vermont at 6.67 percent. (It takes a cool state to make Ben & Jerry’s ice cream.) Surprisingly, fast-paced New York at 9.09 percent came in 21st-place, barely edging out Hawaii at 9.07 percent, with frenetic New Jersey ranking 30th at 8.82 percent. Nevertheless, among the top 10 most-populated states – California, Texas, Florida, New York, Pennsylvania, Illinois, Ohio, Georgia, North Carolina, and Michigan -- the Empire State was the most agitated at 9.09 percent, and the Land of Lincoln was the least at 7.80 percent. While New England state Rhode Island was third-highest at 11.40 percent, two other New England states ranked lowest for high agitation: Maine at 7.68 percent and Vermont at 6.67 percent.
Top 10 States that Lose their Cool
- South Dakota
- Iowa
- Rhode Island
- New Mexico
- Idaho
- Arizona
- Wyoming
- Montana
- Utah
- Nevada
Top 10 States that Keep their Cool
- Vermont
- Maine
- Indiana
- Illinois
- Missouri
- New Hampshire
- Michigan
- Alaska
- Ohio
- West Virginia
Rage Reflects Region
With New England all over the map (pun intended) when it comes to keeping cool, we decided to break up the continental U.S. into regions to find patterns. We divided the 48 states into seven regions:
New England: Maine, Rhode Island, Vermont, Connecticut, New Hampshire, and Massachusetts;
Mid-Atlantic: New York, New Jersey, and Pennsylvania;
Southern: Virginia, West Virginia, Kentucky, Delaware, Maryland, North and South Carolina, Tennessee, Arkansas, Louisiana, Florida, Georgia, Alabama, and Mississippi;
Southwest: Texas, Arizona, New Mexico, and Oklahoma;
Pacific Coastal: California, Oregon, and Washington;
Rocky Mountain: Montana, Idaho, Colorado, Utah, Wyoming and Nevada;
Midwest: Michigan, North and South Dakota, Iowa, Minnesota, Kansas, Nebraska, Ohio, Indiana, Illinois, Wisconsin, and Missouri.

Our Regional Agitation chart has a Rocky Mountain High, with all six of its states in the top 17, and five in the top ten. With entries at both the top (Rhode Island, Massachusetts) and bottom (New Hampshire, Maine, Vermont) of the state chart, New England takes the silver. Despite having the top two states (South Dakota, Iowa), the Midwest region actually is the coolest, with three states producing more calls near the bottom (Indiana, Missouri, Illinois). A sales call from the Rocky Mountain region was 20 percent more likely to be highly agitated than one from the Midwest.
Next Steps
Our large data set of commercial phone calls showed levels of high agitation correlated both with income and geography. A Japanese proverb states: “He who smiles rather than rages is always the stronger.” Perhaps a future study could determine that those who get agitated have worse outcomes in commercial transactions.


